



By Leada Gore
al.com
(TNS)
Inflation-weary retirees won’t see much relief in the latest projections regarding next year’s Social Security increase.
The non-partisan advocacy group The Senior Citizens League’s new estimate predicts the cost-of-living adjustment, or COLA, will be 3.8%, a figure that’s unchanged from last month but 1 percentage point higher than the 2026 COLA of 2.8%.
If the COLA were put in place today, average benefits would rise by $73.62, from $1937.53 to $2,011.15. Making the situation worse—more than half of that increase will likely be eaten up by higher prices for Medicare Part B. Last year, the standard monthly Medicare Part B premium rose $17.90 to $202.90 a month while the annual deductible rose to $283, a $26 increase. 2026 marked the first time the standard premium topped the $200 mark.
Recommended Articles

Payroll October 24, 2025
Social Security COLA for 2026 is 2.8%
Medicare price increase will be announced in November. Social Security COLA will be announced mid-October to take effect in January 2027.
TSCL uses the Consumer Price Index, the Federal Reserve interest rate and the national unemployment rate to make its CLA predictions. The actual COLA is determined by the Consumer Price Index for Urban Wage Earners and Clerical Workers, or CPI-W’s, percentage increase in the third quarter of the year—July, August and September. That figure is compiled and then compared to the CPI-W for the same period the previous year. The year-over-year difference is the new COLA payable in the coming year.
If the COLA stays at 3.8%, it will be the biggest boost retirees have received since 2023.
COLA history
- 1975 – 8%
- 1976 – 6.4%
- 1977 – 5.9%
- 1978 – 6.5%
- 1979 – 9.9%
- 1980 – 14.3%
- 1981 – 11.2%
- 1982 – 7.4%
- 1983 – 3.5%
- 1984 – 3.5%
- 1985 – 3.1%
- 1986 – 1.3%
- 1987 – 4.2%
- 1988 – 4%
- 1989 – 4.7%
- 1990 – 5.4%
- 1991 – 3.7%
- 1992 – 3%
- 1993 – 2.6%
- 1994 – 2.8%
- 1995 – 2.6%
- 1996 – 2.9%
- 1997 – 2.1%
- 1998 – 1.3%
- 1999 – 2.5%
- 2000 – 3.5%
- 2001 – 2.6%
- 2002 – 1.4%
- 2003 – 2.1%
- 2004 – 2.7%
- 2005 – 4.1%
- 2006 – 3.3%
- 2007 – 2.3%
- 2008 – 5.8%
- 2009 – 0%
- 2010 – 0%
- 2011 – 3.6%
- 2012 – 1.7%
- 2013 – 1.5%
- 2014 – 1.7%
- 2015 – 0%
- 2016 – 0.3%
- 2017 – 2%
- 2018 – 2.8%
- 2019 – 1.6%
- 2020 – 1.3%
- 2021 – 5.9%
- 2022 – 8.7%
- 2023 – 3.2%
- 2024 – 2.5%
- 2025 – 2.8%
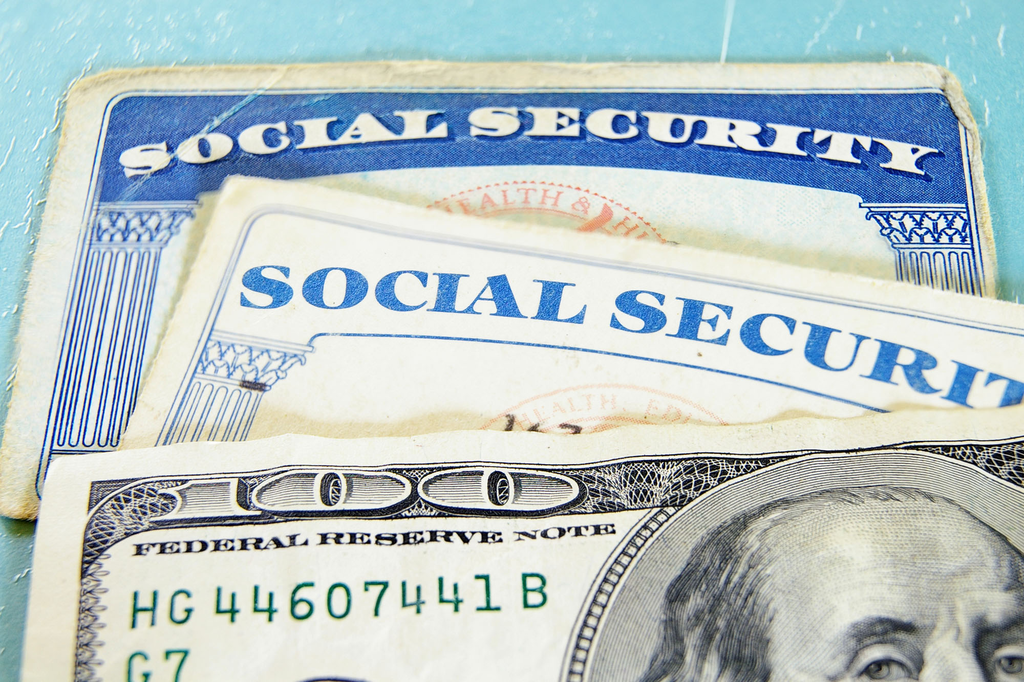
Photo credit: JimVallee/iStock
_______
©2026 Advance Local Media LLC. Visit al.com. Distributed by Tribune Content Agency LLC.
Sign in to get access to this free resource, and all of our whitepapers and reports.

Download this content today!
Register Now Already registered? Click here to Log In