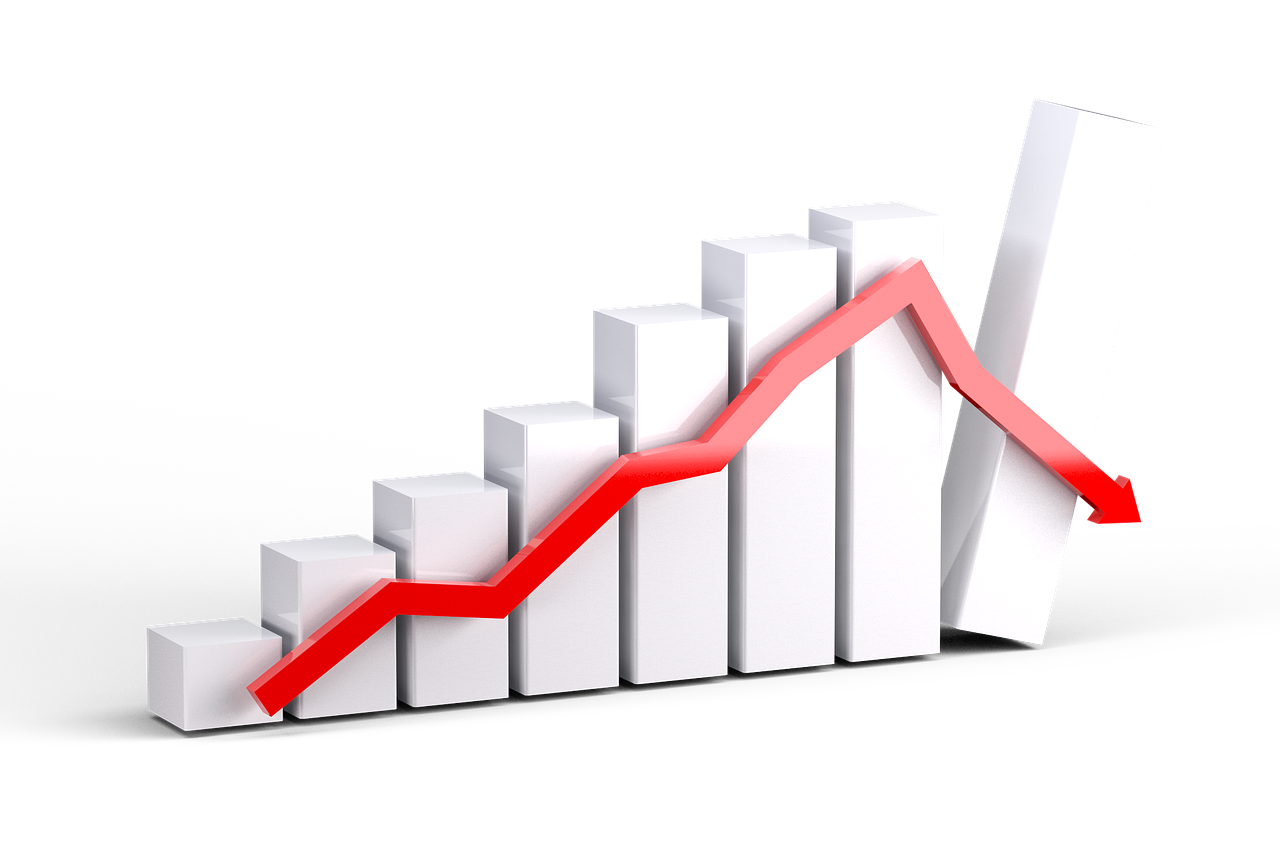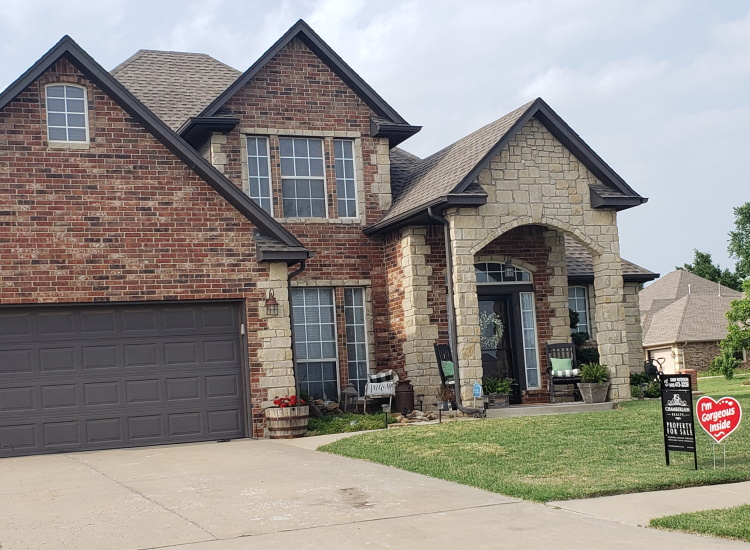




Existing-home sales decreased by 2.0% month-over-month and 1.2% year-over-year, according to the National Association of REALTORS Existing-Home Sales report. The report provides the real estate ecosystem—including agents, homebuyers and sellers—with data on the level of home sales, price, and inventory.
Month-over-month sales held steady in the West and declined in the Northeast, Midwest and South. Year-over-year sales were unchanged in the South and declined in the Northeast, Midwest and West.
“Mortgage rates and home sales move in opposite directions, so it’s not surprising to see a mild dip in home buying activity due to high mortgage rates,” said NAR Chief Economist Lawrence Yun. “Still, home prices are rising, and existing home sales are actually up 1.6% year-to-date through the first eight months of the year. Homebuying demand, despite higher interest rates, is no doubt being supported by rising wages, which grew 3.1% in August, along with 643,000 net new jobs added since the start of the year. Job creation and wage growth typically drive housing demand.”
“The number of months it would take to exhaust the total inventory at the current sales pace has grown to 4.9 months’ supply—its highest level in over ten years. The ample supply of homes for sale on the market is giving homebuyers better opportunities to negotiate,” Yun added.
National Snapshot
Total Existing-Home Sales for August
- 2.0% decrease in existing-home sales¹ month-over-month.
- 1.2% decrease in existing-home sales year-over-year to a seasonally adjusted annual rate of 3.98 million. The last time sales activity fell below 4.0 million was in June 2025.
Inventory in August
- 1.62 million units: Total housing inventory², up 3.2% from July and up 5.9% from August 2025. This was the first time since November 2019 that inventory exceeded 1.6 million units.
- 4.9-month supply of unsold inventory, up from 4.6 months in July and 4.6 months in August 2025.
Median Sales Price in August
- $429,100: Median existing-home price³ for all housing types
- 1.6% increase from one year ago ($422,400)—the 38th consecutive month of year-over-year price increases.
Housing Affordability in August
- The Housing Affordability Index registered at 104.7, up from 101.2 a year ago.
- Year-over-year, affordability improved across all regions.
- Northeast +0.5%
- Midwest +1.7%
- South +4.5%
- West +5.9%
Single-Family and Condo/Co-op Sales
Single-Family Homes in August
- 1.9% decrease in sales month-over-month to a seasonally adjusted annual rate of 3.62 million, down 1.1% from August 2025.
- $434,800: Median home price, up 1.7% from last year.
Condominiums and Co-ops in August
- 2.7% decrease in sales month-over-month to a seasonally adjusted annual rate of 360,000
- Down 2.7% from last year.
- $371,600: Median price, up 1.5% from August 2025.
Regional Snapshot for Existing-Home Sales in August
Northeast
- 4.0% decrease in sales month-over-month to an annual rate of 480,000
- Down 2.0% from August 2025
- $556,900: Median price, up 4.3% from August 2025
Midwest
- 3.1% decrease in sales month-over-month to an annual rate of 940,000
- Down 2.1% year-over-year
- $340,400: Median price, up 3.3% from August 2025
South
- 1.6% decrease in sales month-over-month to an annual rate of 1.84 million
- Unchanged from August 2025
- $366,500: Median price, up 0.7% from August 2025
West
- Unchanged in sales month-over-month at an annual rate of 720,000
- Down 2.7% year-over-year
- $619,100: Median price, down 0.2% from August 2025
Sign in to get access to this free resource, and all of our whitepapers and reports.

Download this content today!
Register Now Already registered? Click here to Log In