When it comes to dining, the top priority of business travelers is “affordable convenience,” which equates to fast food. But when they have the time for something a little more substantial, they still trend toward casual restaurants. Likewise, when it comes to airlines and hotels, business travelers don't view price as the key deciding factor.
That's according to the latest results from the quarterly SpendSmart Report, which reports on millions of business travel receipts and expenses. The report is produced by cloud travel and expense management software provider Certify, which has been tracking corporate travel and expense data since 2009.
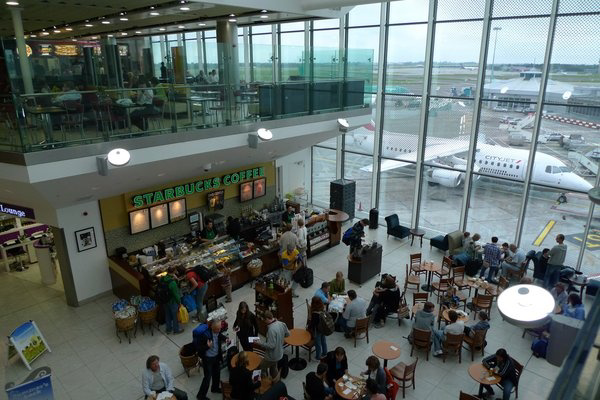
Last quarter, Starbucks showed staying power with the business crowd, capturing the lion share of meal receipts for the fifth quarter in a row. With many ways to caffeinate, free Wi-Fi, breakfast and lunch, and locations everywhere, it’s no surprise. Jimmy John’s, however, moved up the ranks to become the top-rated restaurant for business travelers, beating out Chick-fil-A. Also of note, despite a much higher average meal cost, Panera displaced Subway in the number-three spot for restaurants. In the skies, Delta and United respectively still dominate receipts, but more travelers now say their preferred carrier is Alaska Airlines (which flies to 25 states plus DC, Mexico and Canada) instead of Southwest Airlines. However, Southwest jumped up two spots from fifth-most expensed to third-most expensed airline, indicating that its strategy of friendly service and lower costs are resonating.
“Our research indicates that business travelers look for a combination of convenience, cost and preferred brands when they’re traveling,” says Robert Neveu, CEO of Certify. “In restaurants, travelers continue to use the brands they know, which also happen to be those that show up in travel centers like airports and city centers. The airline business is fairly volatile when it comes to the top five spots on our list, with Southwest, American and US Airways all jockeying for position.”
Highlights:
Most-Expensed Restaurants:
- Starbucks: 5.26% of expenses, averaging $10.68 per receipt
- McDonald’s: 2.76%, averaging $7.94
- Panera Bread: 1.79%, averaging $39.59
- Subway: 1.72%, averaging $15.26
- Dunkin’ Donuts: 1.33%, averaging $11.28
Most Expensed Restaurants by Meal
- Breakfast: Starbucks, 12.9%
- Lunch: McDonalds, 3.27%
- Dinner: McDonalds, 1.72%
Top Rated Restaurants (On a scale from 1 to 5, as indicated by travelers)
- Jimmy John’s 4.5
- Chick-Fil-A 4.4
- Panera Bread 4.3
- Jason’s Deli 4.3
- Chipotle 4.2
Most-Expensed Hotels
- Marriott: 9.05% of expenses, averaging $217.65
- Hampton Inn: 7.42%, averaging $190.67
- Courtyard by Marriott: 6.5%, averaging $156.72
- Hilton: 4.87%, averaging $216.42
- Holiday Inn: 4.27%, averaging $152.92
Top Rated Hotels
- Residence Inn 4.2
- Westin Hotel 4.1
- Marriott 4.1
- Courtyard By Marriott 4.0
- Embassy Suites 4.0
Most Expensed Airlines
- Delta: 20.69%, averaging $408.87
- United: 14.08%, averaging $420.62
- Southwest: 10.99%, averaging $281.59
- American: 10.4%, averaging $379.33
- US Airways: 9.7%, averaging $286.81
Top Rated Airlines
- Alaska Airlines 4.6
- Southwest 4.3
- Delta 4.0
- American Airlines 3.6
- United 3.5
Most Expensed Car-Rental Services
- National: 19.64%, averaging $180.06
- Avis: 15.07%, averaging $175.76
- Hertz: 14.83%, averaging $232.61
- Enterprise: 13.50%, averaging $170.28
- Budget: 4.59%, averaging $206.33
Top Rated Car-Rental Services
- National 4.1
- Avis 4.0
- Enterprise 4.0
- Hertz 3.9
- Budget Car Rental 3.8
Thanks for reading CPA Practice Advisor!
Subscribe Already registered? Log In
Need more information? Read the FAQs
Tags: Accounting, Taxes