Entrepreneurs considering a new business might take into consideration the states with the highest population growth, as well as growth resulting from moves. As opposed to organic population growth, which is the result of births to state residents, relocation growth is the result of individuals or families moving from one state to another. And there are definitely trends that stand out.
Overall Population Growth
Since 2010, the U.S. Census Bureau estimates that the state with the most population growth has been North Dakota, which has increased by about 7.55 percent. Many new residents were attracted by the booming natural gas and shale oil energy markets in the state. Rounding out the top five were Washington D.C., with 7.43 percent growth, Texas at 5.18, Utah at 4.96 and Colorado at 4.76.
The only states and U.S. territories to see a net decrease in overall population were Maine (dropping by less than one hundredth of a percent, Rhode Island, down 0.1 percent, and Puerto Rico, with a population decrease of 2.97 percent.
Relocation Growth
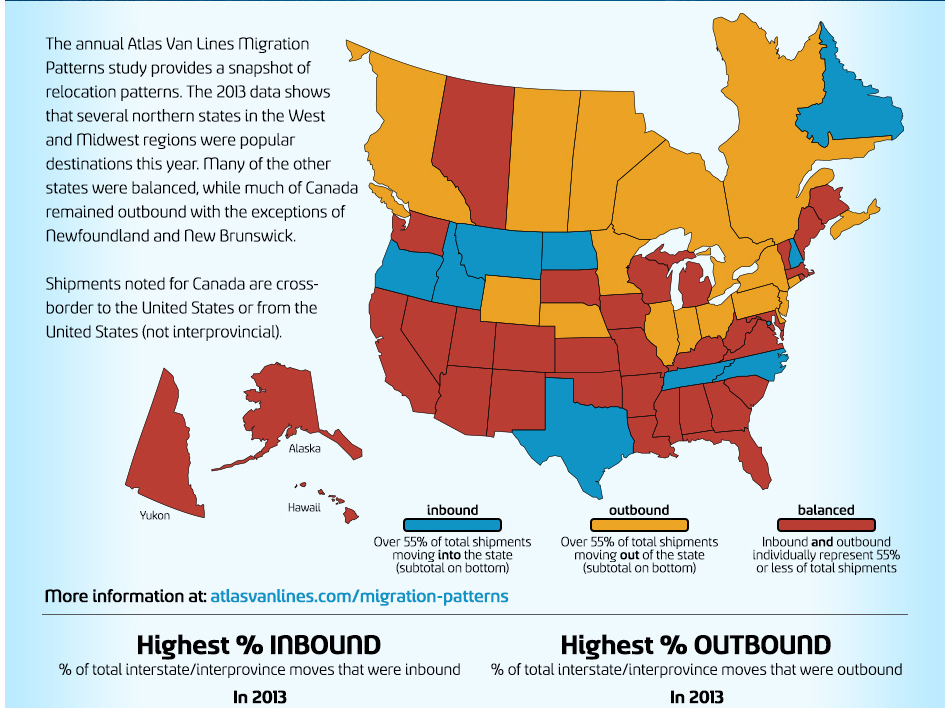
According to one of the nation's leading household moving companies, more Americans relocated to a new state in 2013. The 2013 Atlas Van Lines Migration Patterns study found the majority of U.S. states achieved a balance between inbound and outbound moves, while the total number of moves increased six percent from 2012. Canada's provinces, however, were more likely to see outbound moves and a net decrease. Atlas started conducting the the annual study in 1993 to track the nation's interstate (between states) moving patterns year to year.
Two states that were outbound in 2012 are now balanced states, Vermont and West Virginia. Formerly inbound states Alaska and Washington also became balanced. After spending 2012 as balanced states, Delaware and Pennsylvania became outbound while Idaho and Montana became inbound.
Similar to last year, the highest number of moves occurred in California, Texas and Florida. California comes in at the top with more than 14,500 moves in 2013, which accounts for 19 percent of total interstate moves. North Dakota had the highest percentage of inbound moves, with 67 percent of all moves being inbound. Connecticut experienced the highest percentage of outbound moves totaling 60 percent while New York was close behind with 59 percent.
“Our annual Migration Pattern study provides invaluable insights that relate not only to our industry, but our nation as a whole,” said Jack Griffin, president and COO of Atlas World Group. “This year's findings show more states are balanced between arriving and departing residents while increased overall moves could be an indicator of an improving economy.”
In 2013, the total number of interstate and inter-province moves reached 77,308, up from 73,256 in 2012. In addition, regional trends from the report show the most significant changes occurred in the Northern and Western states:
Northern States
The Northern states underwent major change from 2012 to 2013. Pennsylvania went from being a balanced state to outbound; Vermont and West Virginia both went from being outbound states to balanced; and Delaware went from being balanced to outbound. Washington DC remains as the only northern location to be inbound for 11 consecutive years.
Southern States
The Southern states saw no change from 2012 to 2013. The majority of the Southeast and Mid-Atlantic states remain balanced with the exception of Tennessee and North Carolina, which both remain inbound states. All of the Southwest states remain balanced in 2013 excluding inbound Texas.
Midwestern States
Mirroring last year's data, Illinois, Indiana, Ohio, Minnesota and Nebraska remained outbound while Kansas, Missouri, Michigan, Wisconsin and Iowa remained balanced. North Dakota remained inbound. No Midwestern state has been classified as inbound for more than 10 consecutive years.
Western States
The Western states also experienced significant change since 2012, particularly with Montana and Idaho shifting from balanced to inbound states. Additionally, Washington went from inbound to balanced, leaving the majority of the Western Unites States balanced.
Canadian Provinces
Five of the 10 provinces remain outbound – British Columbia, Manitoba, Nova Scotia, Ontario and Saskatchewan. Having moved to inbound in 2012, New Brunswick is back to being balanced. Another noteworthy change is that Quebec went from being balanced to outbound. Two territories – Nunavut and Yukon Territory – are unclassified, while the third territory – Northwest Territory – is outbound.
How status is determined
Each state's or province's status is determined by its threshold value, which is the total number of shipments multiplied by 0.55 (i.e., in a state with 100 moves, at least 55 must be outgoing to be considered outbound). All other states or provinces in which outbound or inbound numbers don't exceed the threshold are classified as balanced. Shipments noted for Canada are cross-border to the U.S. or from the U.S. (not inter-provincial).
To view full results of the 2013 migration patterns, a map and annual histories for each state, visit www.atlasvanlines.com/migration-patterns/. For an infographic on the results, visit www.atlasvanlines.com/infographics/2013-migration-patterns/.
Thanks for reading CPA Practice Advisor!
Subscribe Already registered? Log In
Need more information? Read the FAQs
Tags: Accounting